Core data in this article: Container shipping prices, freight rate indices, number of vessels, container production, export volume
1. Container shipping rates have soared since the outbreak of the pandemic
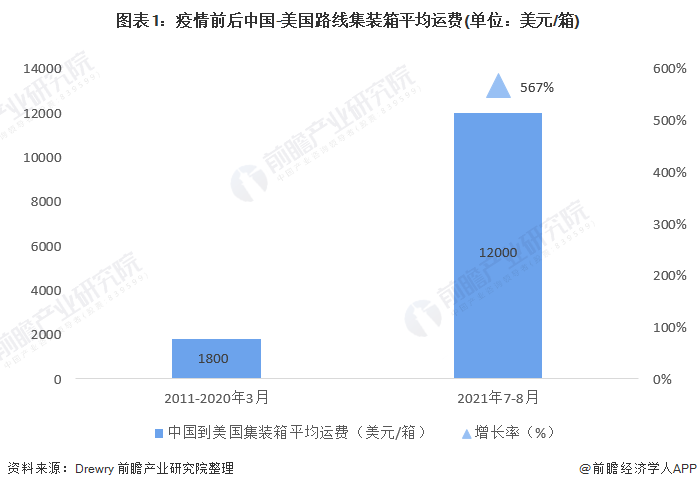
Since last year, global container shipping rates have rocketed upward. Bloomberg reported that before the pandemic, most shipping analysts could not imagine a container shipped from Asia to the U.S. being charged $10,000 per container. According to Drewry data, the average freight rate from Shanghai to Los Angeles between 2011 and March 2020 was less than $1,800 per container. Since July 2021, the listed price for shipping from China to Europe and major ports on the U.S. West Coast has approached $12,000 per container, and some companies said they were ultimately charged $20,000 before their cargo was loaded.
2. In 2021, the freight rate index continued to rise to a new high
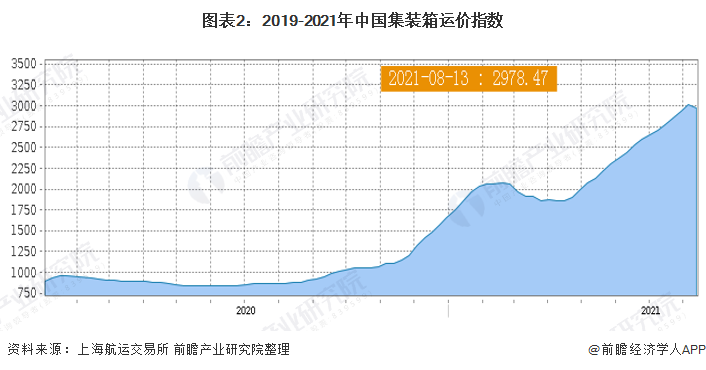
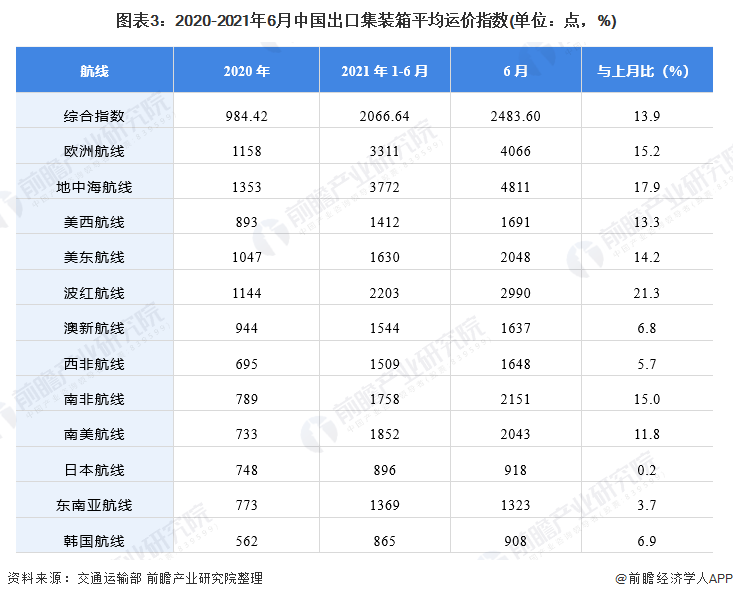
According to industry consultancy Container Trades Statistics (CTS), the average China Export Container Freight Index (CCFI) was 984.4 points in 2020. In the first half of 2021, the average CCFI reached 2,066.64 points, a year-on-year increase of 133.86%. By August 2021, China's freight rate index continued to soar, reaching 2,978.47 points.
3. Freight rate indices for the Europe and Mediterranean routes grew rapidly
In 2020, the average freight rate index for European routes was 1,158 points. By June 2021, the European freight index had reached 4,066 points, up 15.2% period-on-period; the Mediterranean freight index rose from 1,353 points in 2020 to 4,811 points.
4. In recent years, China's oceangoing vessels have decreased, but container slots have continued to increase.
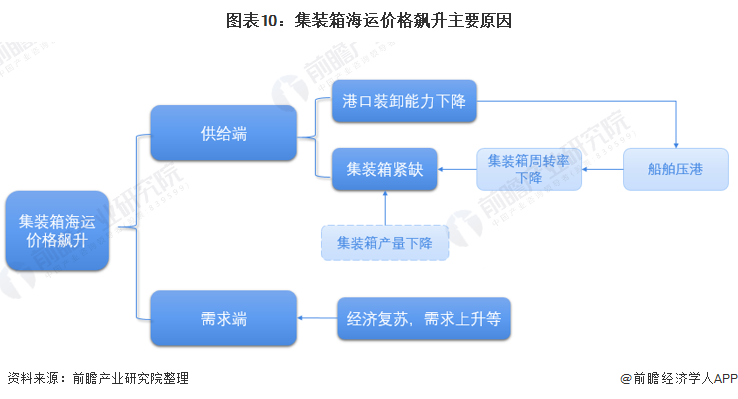
Is the surge in container shipping prices caused by reduced supply? Next, Qianzhan will analyze from both the supply side and the demand side.
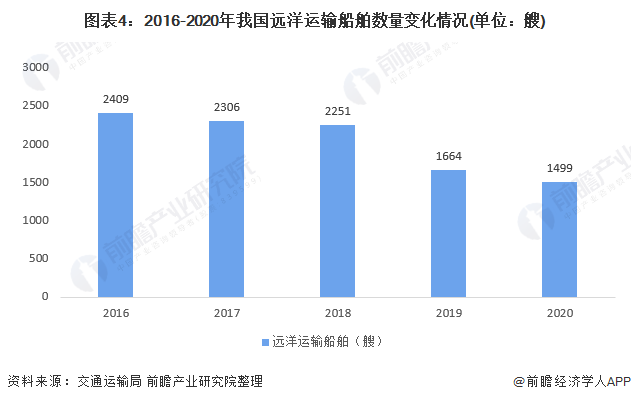
From the supply side of China's oceangoing vessels in recent years, from 2016 to 2020, the number of China's oceangoing transport vessels showed a downward trend. In 2020, the number of China's oceangoing transport vessels was 1,499, a decrease of 9.9% compared with 2019. Compared with 2016, the number of oceangoing transport vessels in 2020 decreased by about 900, a drop of 39.8%.
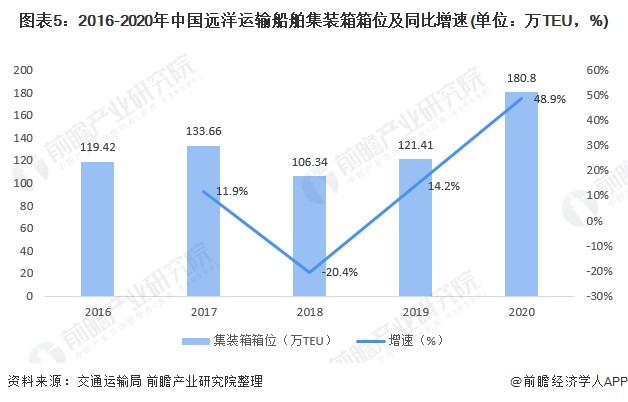
Although the overall number of oceangoing transport vessels has decreased in recent years, the container slot capacity of China's oceangoing transport vessels has continued to climb since 2018. In 2020, the container slot capacity of China's oceangoing transport vessels reached 1.808 million TEU, an increase of 48.9% year-on-year. Therefore, the reduction in oceangoing vessels is not the main reason for the surge in container shipping prices from 2020 to 2021.
5. In the past two years, China's container supply has decreased overall.
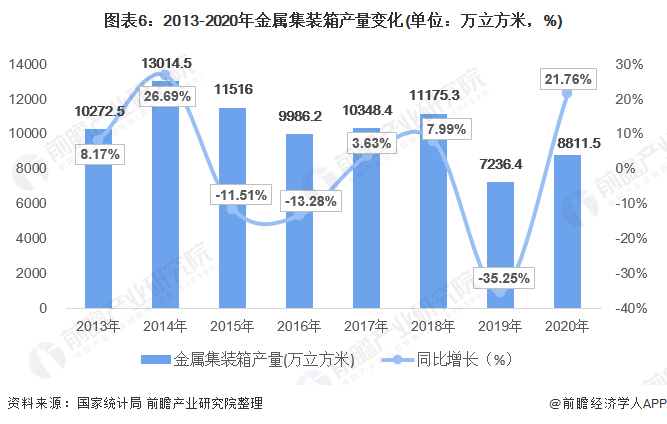
Analyzing from the container supply side, from 2013 to 2014, world merchandise trade grew moderately, and China's metal container output also increased. In 2014, metal container output reached 130.145 million cubic meters, a year-on-year increase of 26.29%, the highest output and largest increase in recent years. In 2019, affected by the global economic slowdown and tense international trade situation, metal container output dropped significantly. In 2020, China's metal container output was 88.115 million cubic meters, up 21.76% year-on-year, but compared with 2013-2018, the output of China's metal containers in the past two years remained at a relatively low level.
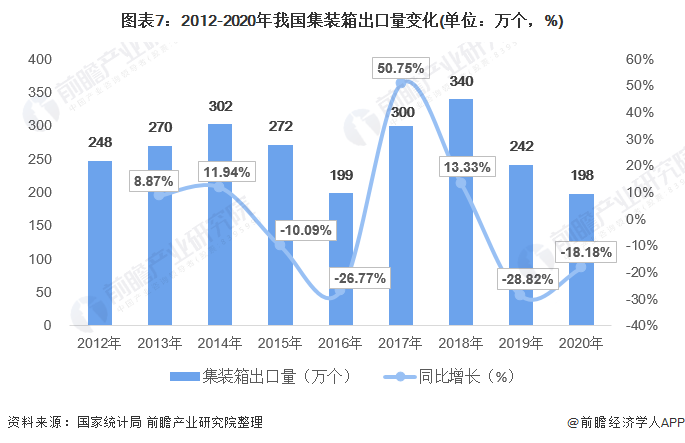
From 2012 to 2020, changes in the export volume of China's container manufacturing industry were basically consistent with changes in China's container output. From 2012 to 2014, world trade grew steadily, and demand for containers in the international shipping market increased, so China's container exports continued to rise. Since 2015, China's container exports began to decline. In 2016, China's container exports were 1.99 million units, down 26.77% year-on-year, the lowest export volume and the largest decline in recent years. Affected by the global economic slowdown, China's container exports decreased from 2018 to 2020. In 2020, China's container exports were 1.98 million units, a year-on-year decrease of 18.18%.
6. Demand in China's container transport market is slowly rising.
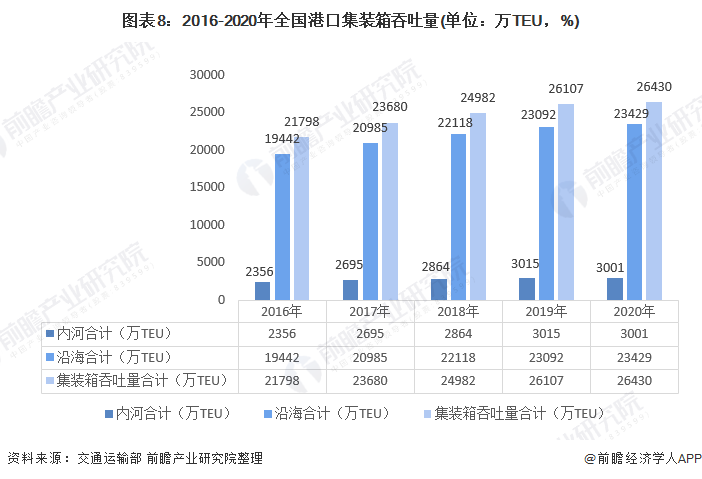
From the demand side, the demand for container transportation in China has risen slowly. From 2016 to 2020, the container throughput of ports above designated size in China increased year by year, reaching 264.30 million TEU in 2020, a year-on-year increase of 1.2%. Among them, coastal ports completed 234.29 million TEU, an increase of 1.5%; inland river ports completed 30.01 million TEU, a decrease of 0.5%.
7. Ship congestion at ports and declining container turnover efficiency are the main reasons for the rise in freight rates.
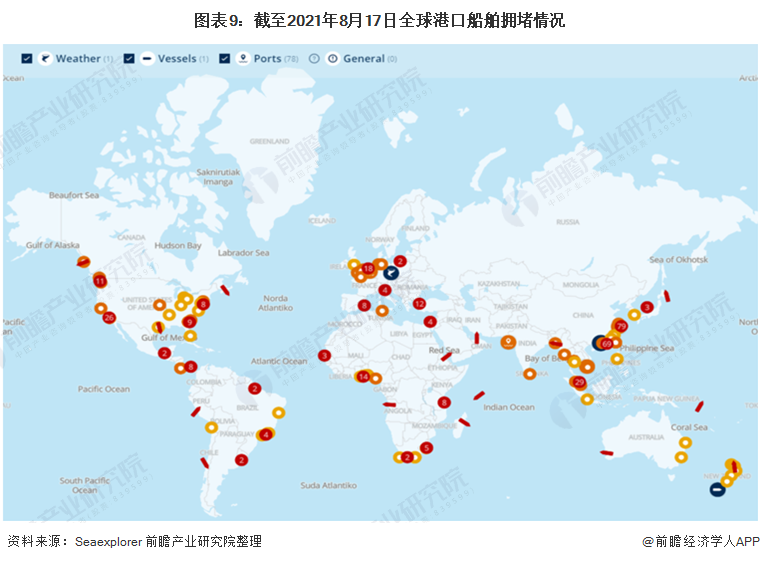
In 2020, after the outbreak of Covid-19, ports at home and abroad began to implement strict inspection and control measures to prevent the import of the epidemic from abroad. As a result, cargo ships arriving at ports had to queue to enter, causing severe port congestion, low ship turnover, tight capacity and shortage of container ship space. In addition, the resumption rate of foreign terminals was not high, the time for loading and unloading ships increased, and port handling efficiency declined. According to Seaexplorer data, as of August 17, 2021, due to operational disruptions at many ports on various continents, more than 346 vessels of major international shipping lines are currently anchored outside ports.
Overall, the decline in China's container output over the past two years may be one of the reasons for the surge in sea freight prices. However, the primary reason is that epidemic control measures have led to port congestion and a significant drop in container turnover rates. According to the China Container Industry Association, the global pandemic has caused severe retention of empty containers overseas, reducing container turnover efficiency. Currently, only one container can be returned for every three exported, with large numbers of empty containers backlogged in the United States, Europe, Oceania, and elsewhere, affecting container turnover efficiency. From the demand side, factors such as global trade recovery and inflation resulting from U.S. monetary easing have pushed up sea freight prices, jointly driving the rise in container shipping rates.